
Repository Activity
For each repository, the Activity tab displays insights about the recent changes. It helps figure out how lively it is and which contributors are the most active at a given moment in time.
Contributors
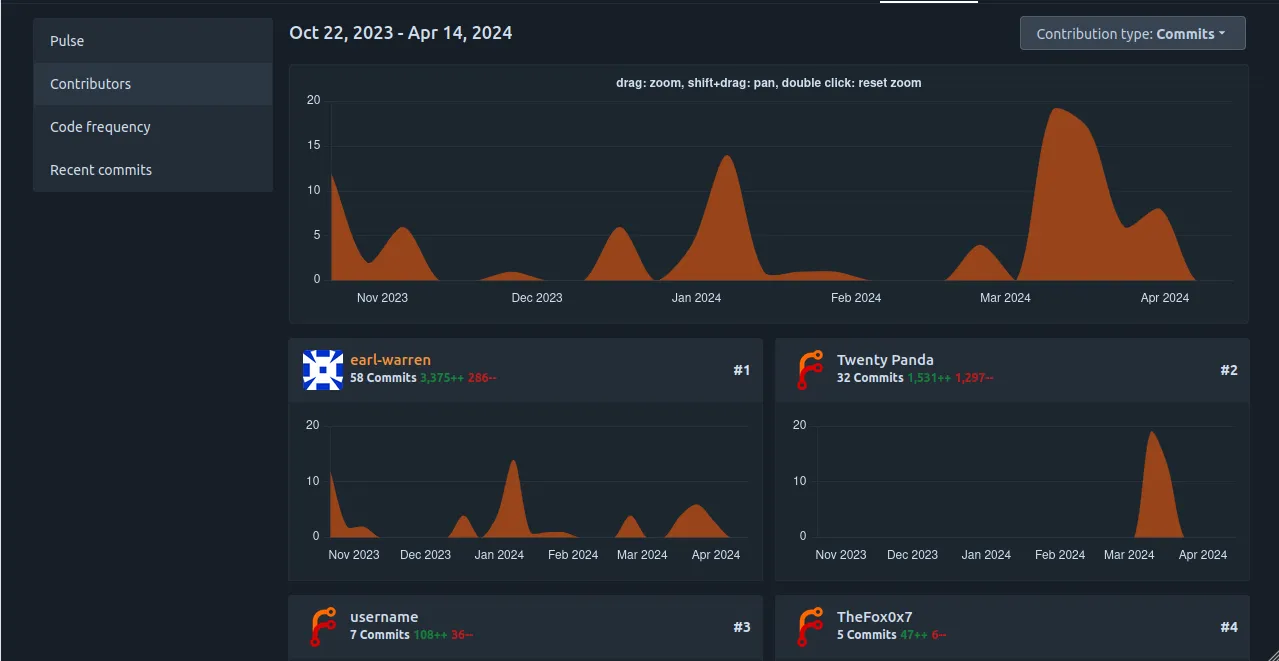
The overall graph shows all commits over time and allows you to select a range of dates to get a more detailed view. The contributors are also displayed with their individual graphs. The contributor with the most commits is shown first.
Pulse
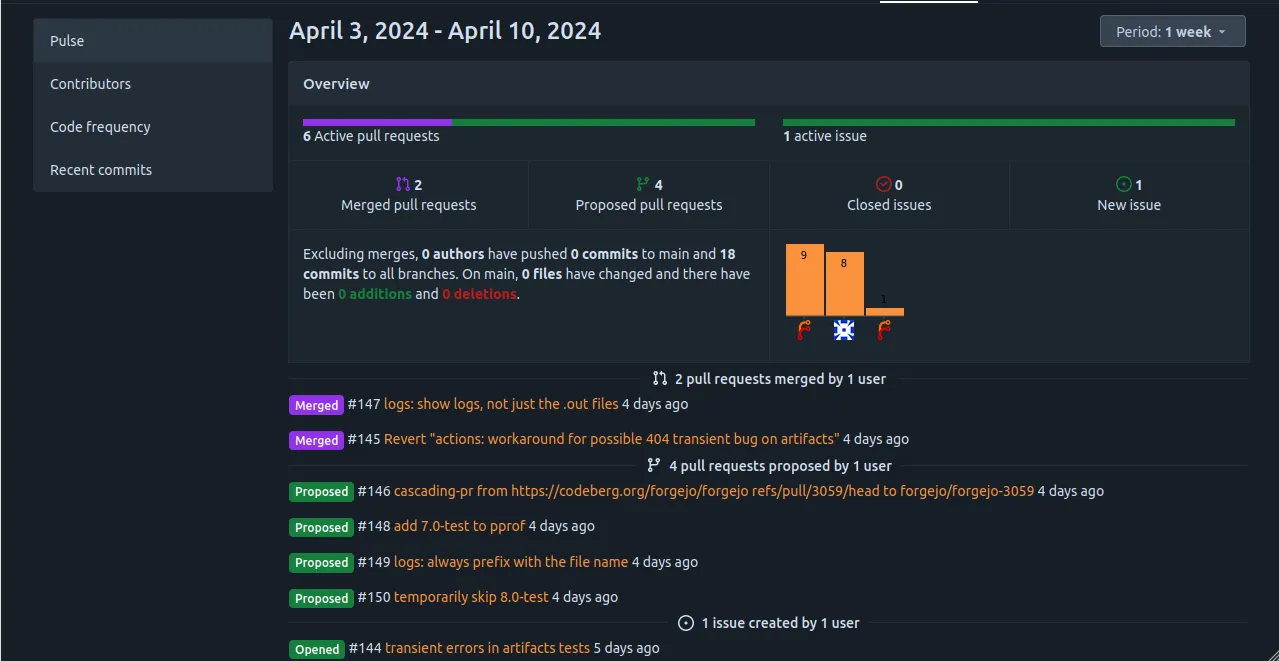
A high-level view of the most recent commits and pull requests.
Code frequency
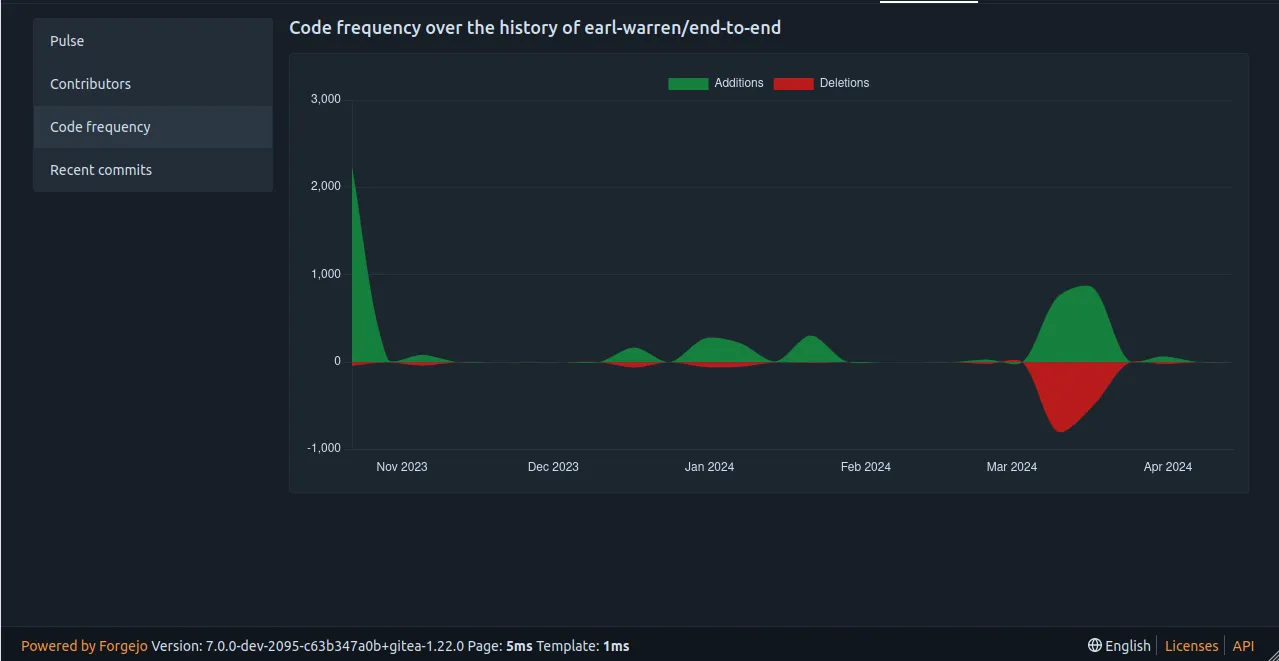
Shows the ratio of added and deleted lines over time.
Recent commits
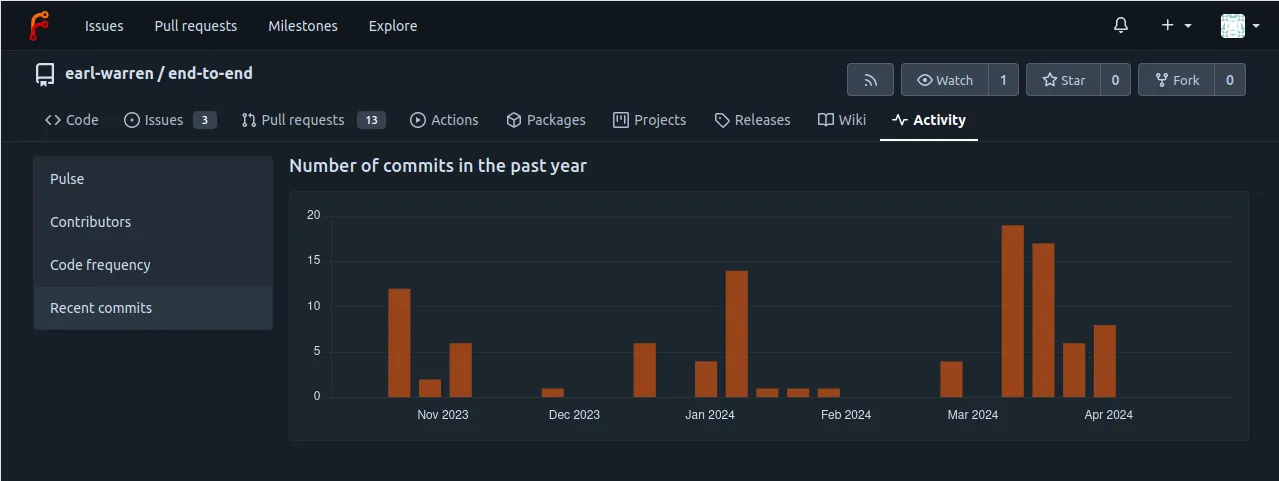
The total number of commits over time.